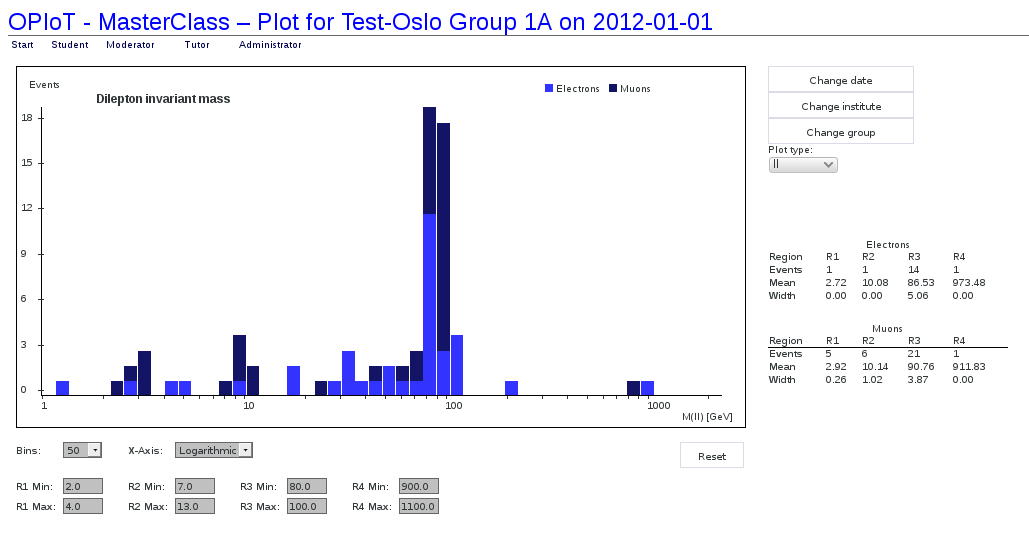
You have now gone through a lot of events in HYPATIA (or the program of your choice), carefully classifying each. OPloT is the tool that will display the fruits of your labor for you - you upload the files with the invariant masses of the events, and up comes a histogram displaying the distribution.
An example of how OPloT can be used, is shown below (to test the plot, go to "OPloT test" in the menu above). Here you can manually input invariant masses of dileptons or dimuons, and the tool plots them for you. You can adjust the number of bins and choose between logarithmic and linear x-axis. The four regions are also adjustable. The mean value and width of the four regions are shown in the table to the far right, for dielectrons and dimuons separately.
